


Your days as an institutional allocator are centered around data: researching, analyzing, strategizing, reporting on it, and more. But the core task of most allocators is to generate new investment ideas. To do that, you need to meet with managers and high-influence market participants, and then have time to sit down and digest what you heard. How, then, to make room in your day for these two seemingly dichotomous things?
One way is to optimize the ways allocators work with data. That’s exactly what we’re doing at Backstop. As a Backstop allocator client, you have benefited from multiple improvements released over the last year to enhance how you work with data. Here are nine ways to make the most of every minute:
1. Visualize your research data.
You have a wealth of research data available – but can you get to the insights hidden in your market research? Our Research Dashboards are the ticket to turning raw data into remarkable insights. You can view your data any way you like: focus on geography, on how many searches you have run, on minimum criteria, on regional trends … just name the filters and the results are instantly visualized in the Dashboard with perfect clarity.
2. Share customized reports.
Any visualization from our Research Dashboards can be readily shared across your organization. You can roll up broad searches and analyses for your CIO to review, or send a snapshot of your private equity deal management to a team member as an update. Plus, you never have to worry about a report not going deep enough ” Backstop lets any user delve into the data behind the graphs and charts for additional detail.
3. Slice and dice multi-asset class data.
With Backstop’s Vehicle Explorer, you can take your entire data set – including all your multi-asset class vehicles – and slice and dice them on the fly. For example, you can sort by interest level, asset type, strategy, activity, or any other factor to get to the granular data you want. Vehicle Explorer gives you the ability to explore, aggregate, and export your data using up to five data fields simultaneously. Our clients regularly use the tool to sort through hundreds of managers and strategies to identify the handful they need to see at any given moment.
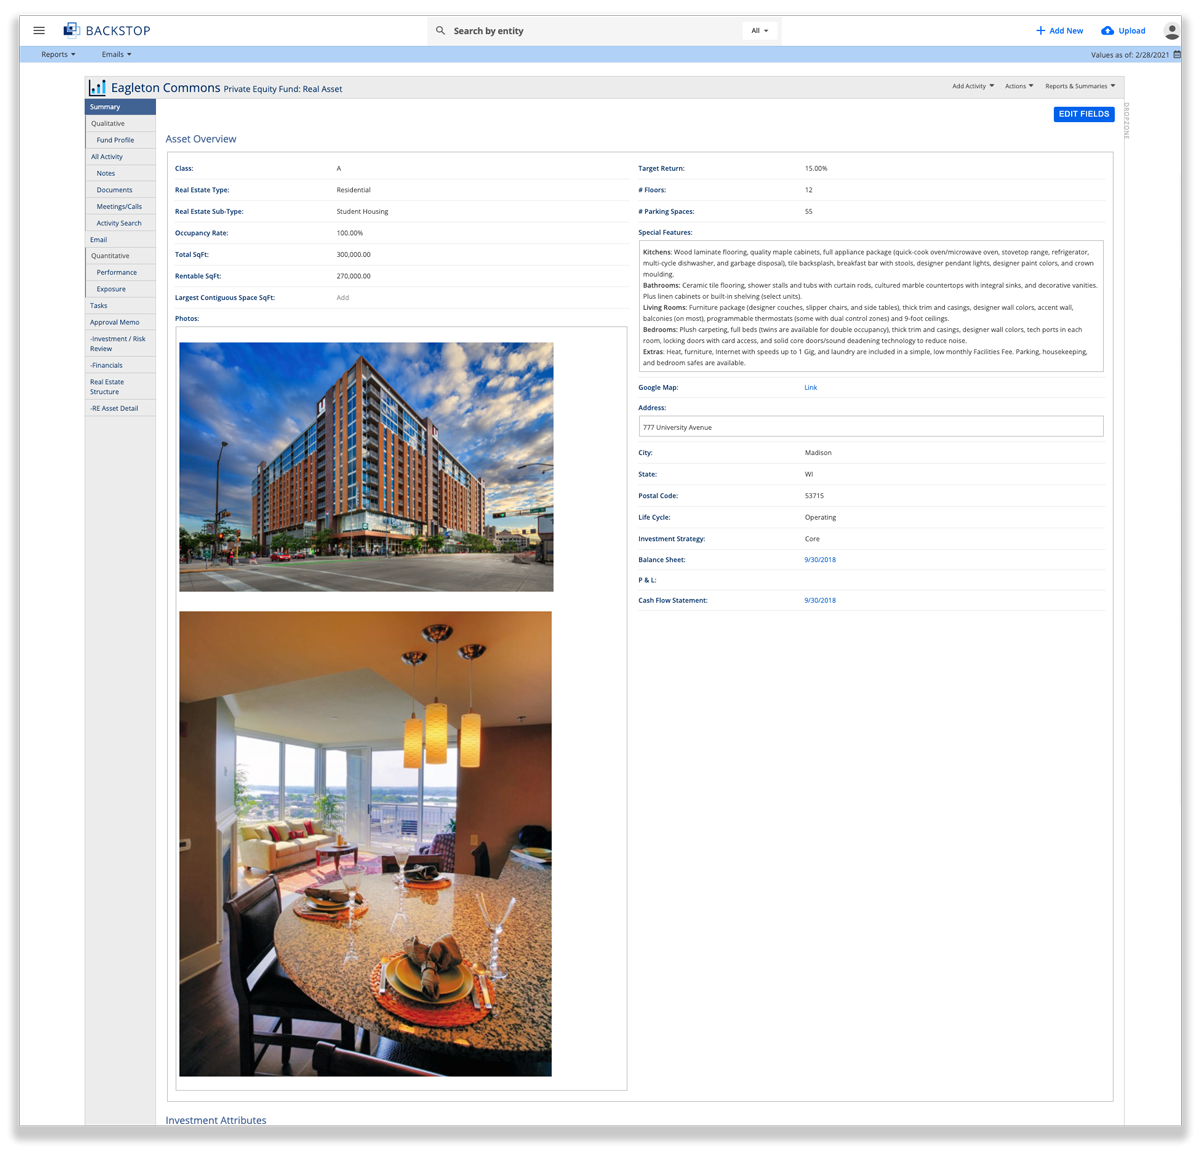
4. Track the precise data you need for each investment.
Within Backstop, you can create views for assets that contain the exact fields you want. For example, a wind farm for alternative energy might have a field for performance reliability. However, you might not want that field to appear across your portfolio, since it is irrelevant elsewhere and would simply clutter the screen. No problem: you pick the fields you want to show across all your investments, such as ESG, and the fields you want to track only for specific investments or investment types.

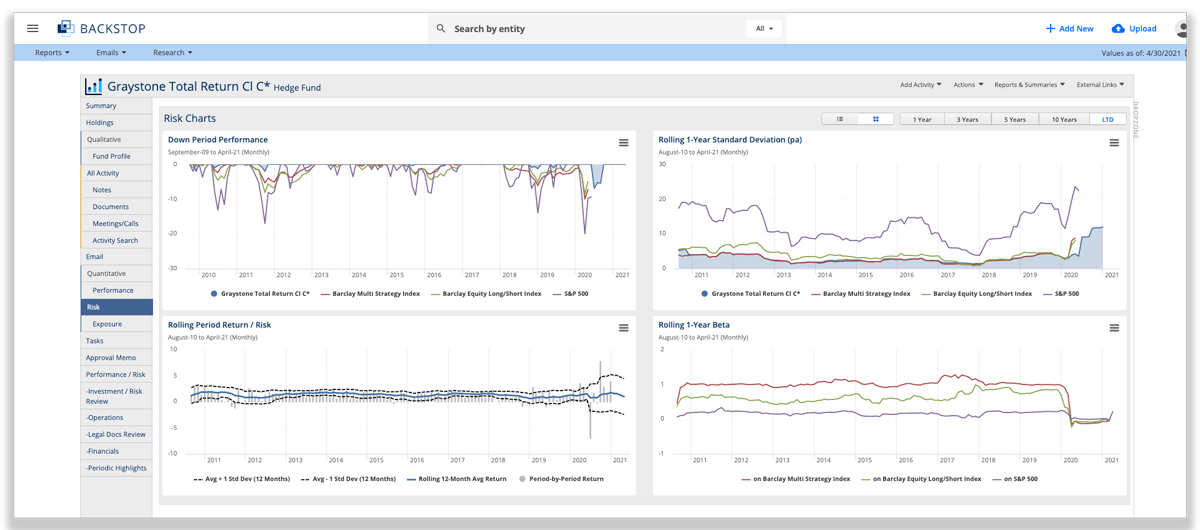
5. Bring in benchmarks to gain insights.
Many times, you want to bring benchmarks into your view of an investment to make comparisons and gain insights. We enable you to bring up to eight different investment benchmarks (e.g., performance statistics or charts) into any of your investment vehicles, from hedge funds to private equity funds to traditional investments.
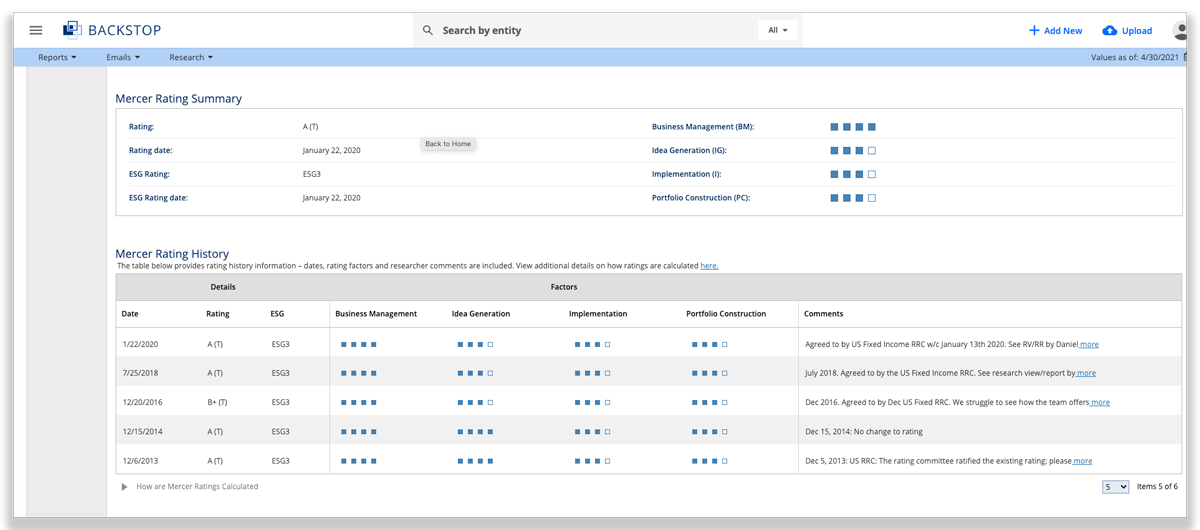
6. House Mercer data alongside your internal data.
In 2020, Backstop announced a strategic alliance with Mercer to further support our clients through COVID–19 and beyond in maintaining continuity of manager monitoring and investment due diligence when onsite visits are next to impossible. As a result, clients can view Mercer’s in-depth global institutional data and forward-looking research and ratings from MercerInsight right in Backstop, making it easier to streamline workflows, eliminate noise, and access the right information to help make informed investments decisions as we all adjust to this new normal.
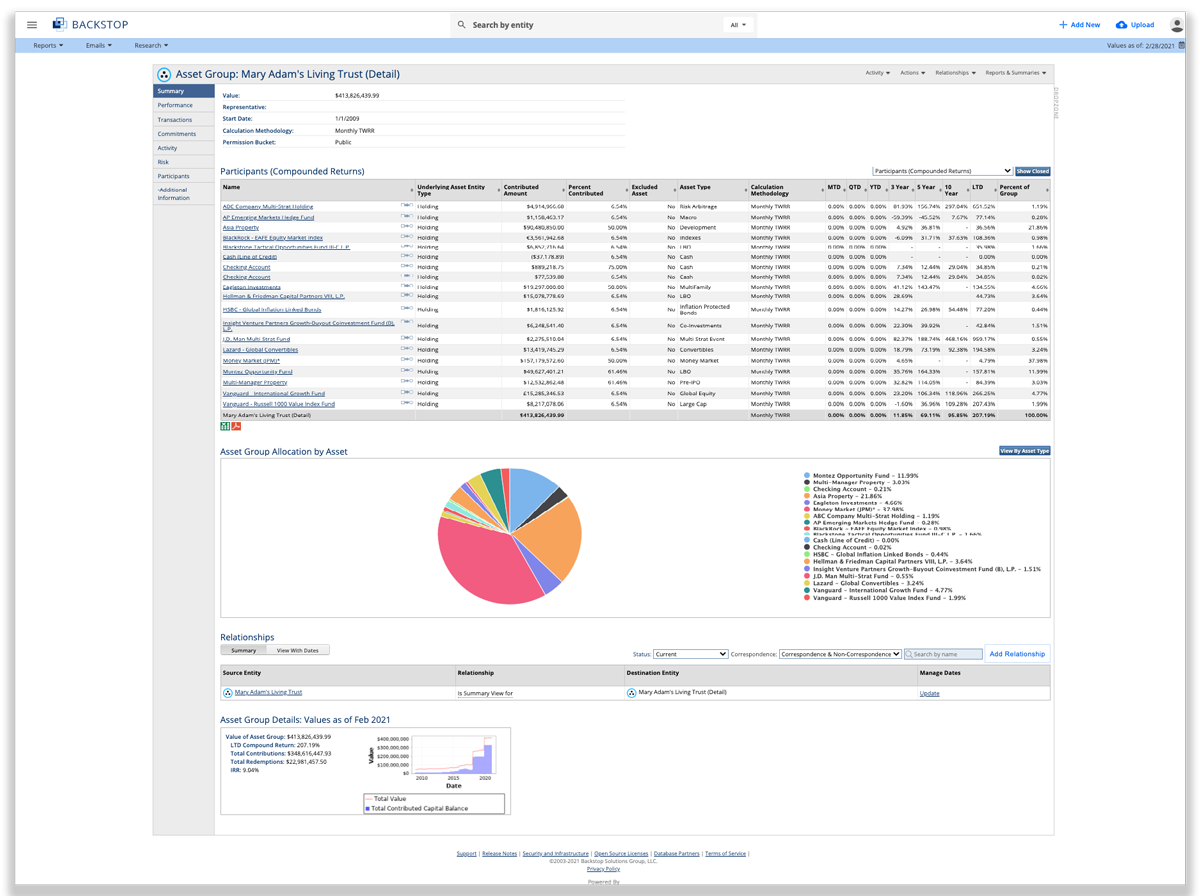
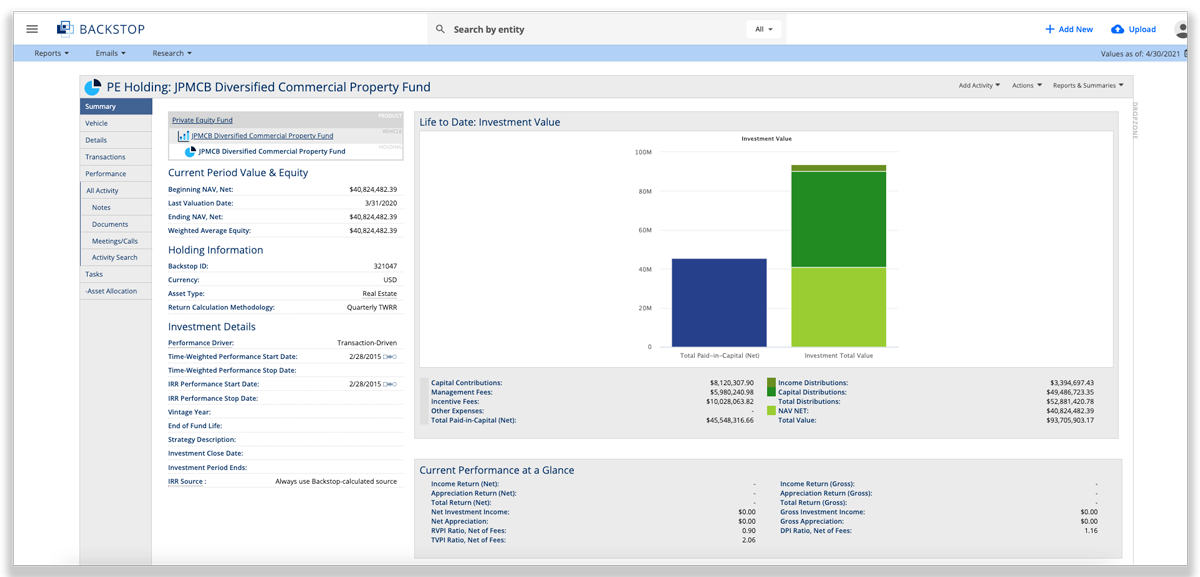
7. Aggregate different investment vehicles instantly.
If you are on a call with a manager or investor and need to refer to several investment vehicles simultaneously, Backstop aggregates the data in a flash and delivers it to you via interactive charts. You can immediately look at AUM, investment amounts, strategy return, and more – it is all at your fingertips.
8. Automate document management.
Retrieving fund documents from emails and web portals, downloading them, renaming them, tagging them, and filing them is a constant drain on your time. Backstop IntellX automates the process end to end using robust machine learning capabilities and sophisticated document classification methods. That means all the documents you need are always correctly filed and available in Backstop.
9. Automate fund transactions.
Backstop IntellX not only processes documents automatically – it also processes fund transactions automatically. IntellX loads current balances and cashflows and uses powerful calculation and reporting engines to reconcile transactions in real time. This way, you have the certainty that all transactions are identified, processed, and reconciled accurately.
At Backstop, we streamline and simplify these nine activities ” and countless others “ so you can focus on driving the best possible outcomes for your organization.
Learn more by downloading our datasheet on the Backstop Multi-Asset Class Research Management Solution.